
SEV 1 Party:
Telling the tale is living
Not living to tell the tale.
The low and high sev adventures of Molly Sheets.
Please donate to Every Girl Shines!
-

How to Have Ownership When You Don’t Have it At All
Read more: How to Have Ownership When You Don’t Have it At AllA treatise of how to have respect for your colleagues in a world of ASAP.
The Latest Sass
-
Jump into the Void of Irony
Warning: Authentic and acceptably verbose cussing included
-
Kicking the One Onboarding Path to the Curb

There is no one onboarding path and there really should not be for teams with 20+ products.
-
Laughter Was Reserved for Judgement
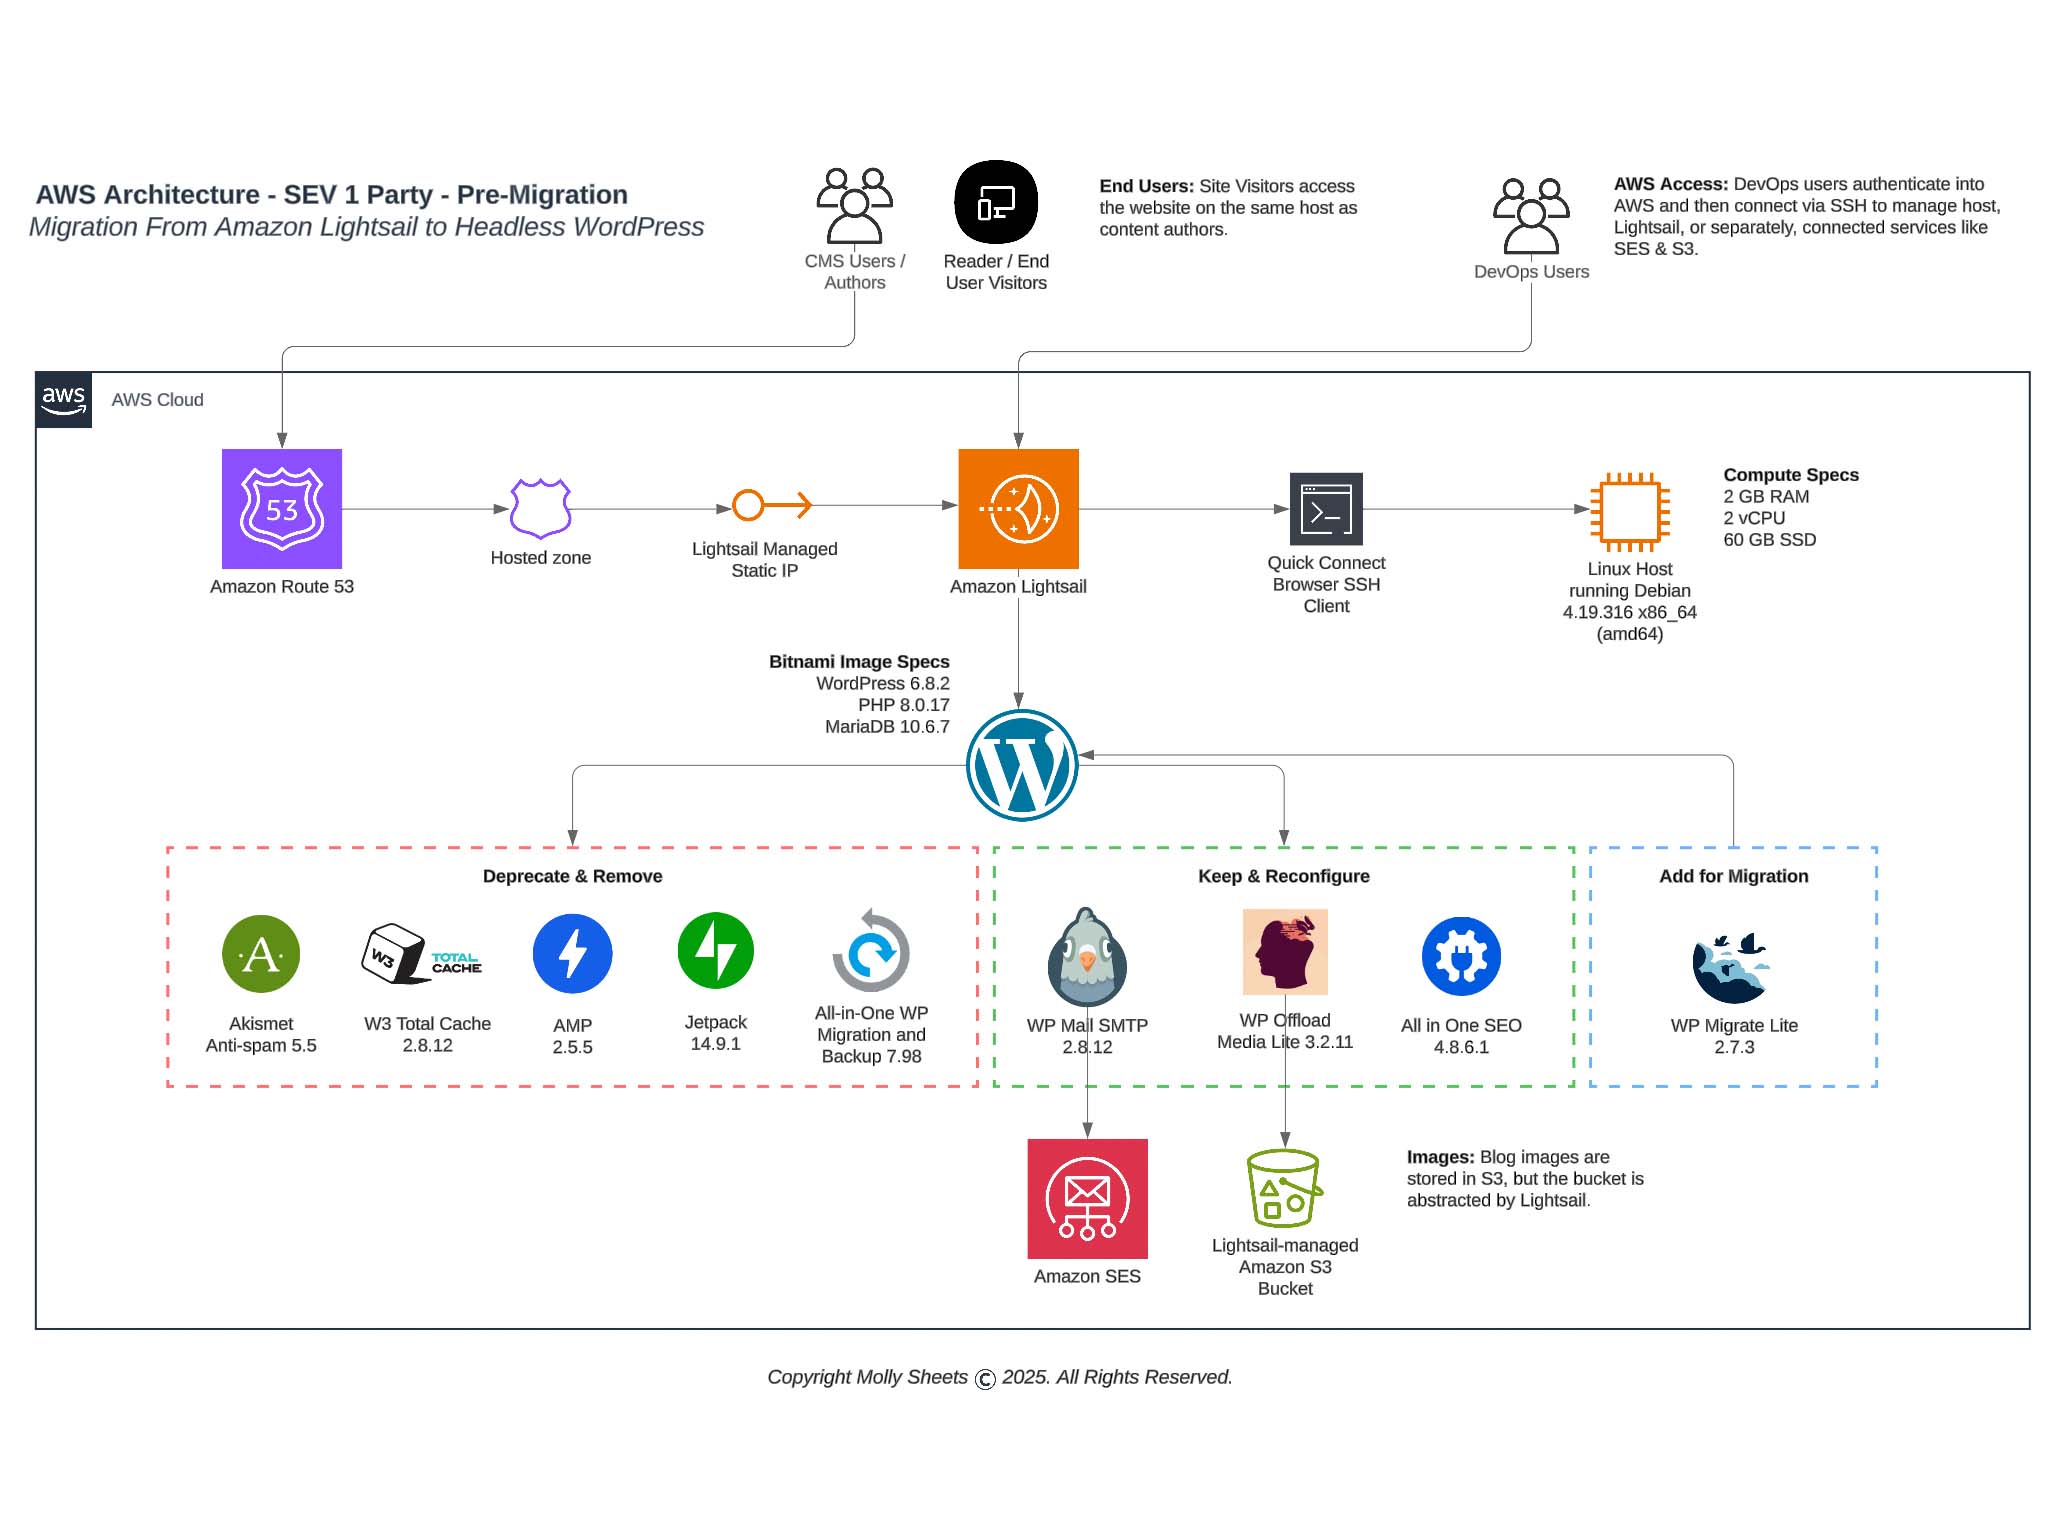
Reporting to you live 80% through a migration from Amazon Lightsail to Simply Static on Amazon S3.
Organization of the Year: Every Girl Shines
I am so pleased to switch up this section and feature one of my favorite organizations: Every Girl Shines. My husband and I have been a donor to Every Girl Shines since 2019 as we love their mission, have bold belief in their leadership team, and continue to be amazed by EGS’s impact to young middle and high school girls.
Every Girl Shines is a 501c3 non-profit that provides mentorship, networking, charity, and university scholarships so that every girl has a chance to become a leader in her community.